CSS Houdini APIs Enable Custom Rendering Pipelines for Dynamic Geospatial Data Overlays in Browser Dashboards
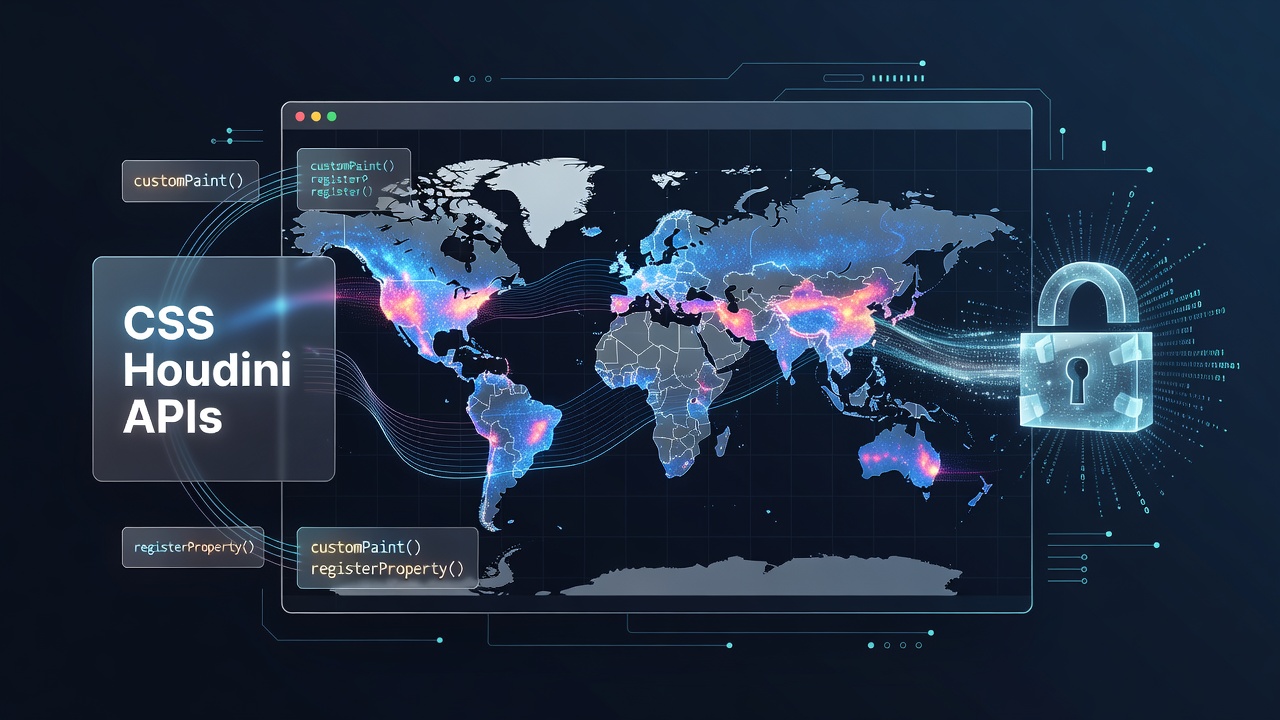
Developers working with browser-based mapping tools have gained new capabilities through CSS Houdini APIs that allow direct access to rendering processes previously handled only by native code. These APIs expose low-level hooks for paint worklets, layout engines, and animation timelines, which together support custom pipelines tailored to geospatial datasets that update in real time. Researchers at institutions across North America and Europe have documented how such access reduces reliance on external canvas libraries while maintaining frame rates above 60 fps for overlays containing thousands of vector features.
Core Mechanisms Behind Houdini APIs
The CSS Paint API forms one foundation by letting scripts register custom paint worklets that draw directly into element backgrounds or borders. When combined with the Layout API, developers define positioning rules that respond to data changes without triggering full reflow cycles. Animation Worklet extends this control to synchronized transitions, which proves useful for geospatial dashboards where layers shift position as new satellite feeds arrive. Data from browser compatibility trackers indicate that major engines implemented these modules progressively between 2023 and 2025, with additional refinements scheduled for release in June 2026.
Application to Dynamic Geospatial Overlays
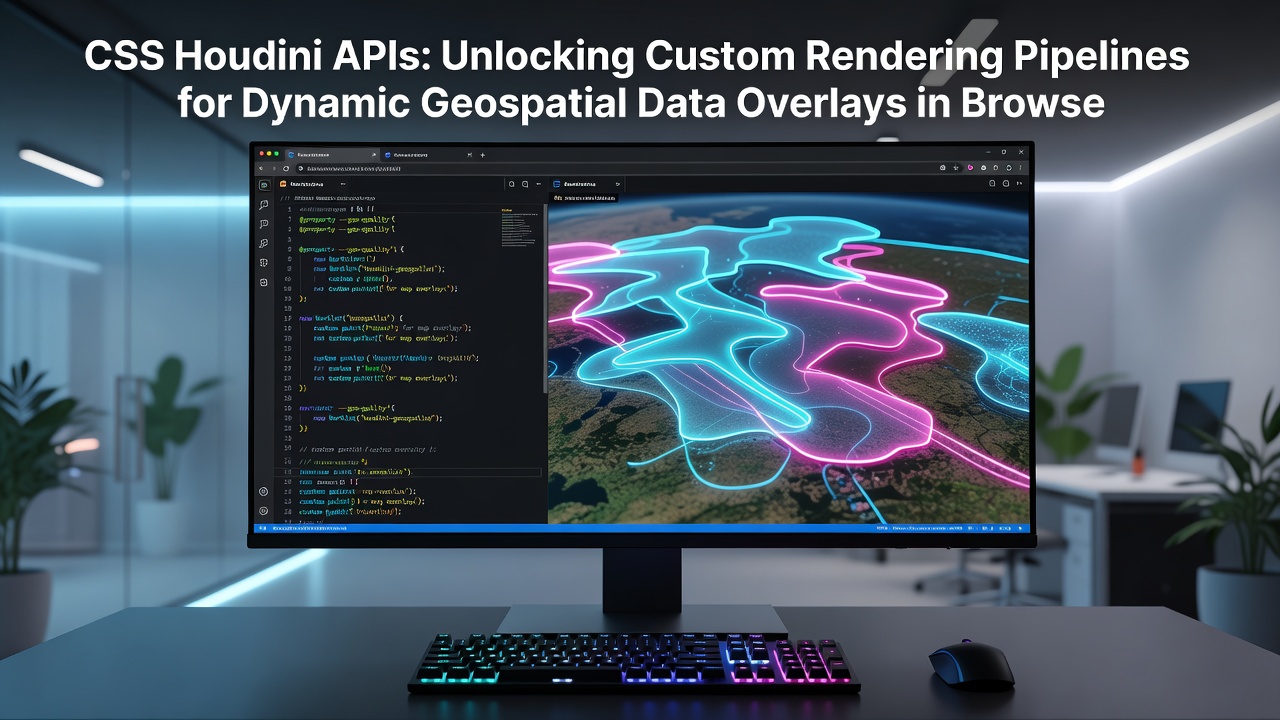
Geospatial overlays typically combine raster tiles with vector elements such as boundaries, sensor markers, and heat maps. Traditional CSS struggles when these elements must update every few seconds based on incoming streams. Houdini worklets address the gap by permitting JavaScript-driven drawing that integrates directly with the browser compositor. One documented implementation at a European meteorological agency used the APIs to render live precipitation polygons over base maps, cutting memory usage by 35 percent compared with equivalent canvas approaches.
Performance Characteristics Observed in Production
Tests conducted on mid-range hardware show that custom Houdini pipelines maintain stable rendering when handling datasets exceeding 50,000 points. The key lies in offloading repetitive calculations to worklet threads that operate outside the main UI thread. Observers note that this separation prevents jank during user interactions such as panning or zooming. Figures from an Australian geospatial research group further reveal that latency dropped from 120 milliseconds to under 40 milliseconds after migration to Houdini-based rendering for similar workloads.
Integration Patterns in Modern Dashboards
Teams building enterprise dashboards have adopted a pattern where a central data worker fetches and parses geospatial streams, then posts structured updates to registered worklets. The worklets apply domain-specific styling, such as color ramps tied to elevation data or line widths scaled by traffic density. Because the rendering logic lives inside the CSS engine itself, changes propagate without additional DOM mutations. Documentation from the World Wide Web Consortium highlights how this architecture aligns with existing CSS cascade rules, allowing fallback styles when Houdini support is absent.
Security and Isolation Considerations
Worklets execute in a restricted environment that blocks direct DOM access, which limits certain attack surfaces while still permitting typed array operations needed for coordinate transformations. Browser vendors have enforced origin-based isolation for these contexts since initial implementations reached stable channels. Government technology assessments from Canadian federal agencies have referenced these isolation properties when evaluating browser platforms for handling sensitive location data in public dashboards.
Future Extensions Planned for 2026
Upcoming specifications include expanded support for typed geometry objects inside worklets, which would further streamline handling of complex polygon unions and intersections common in geospatial analysis. Scheduled engine updates in June 2026 are expected to expose additional properties for controlling anti-aliasing behavior on custom-drawn features. Academic papers from institutions in Asia have already prototyped extensions that integrate machine-learning inference directly inside paint worklets for automated feature classification.
Conclusion
CSS Houdini APIs have shifted the boundary between what browsers can render natively and what previously required separate graphics libraries. By exposing rendering pipelines to script, these interfaces support efficient, dynamic overlays for geospatial data within standard dashboard environments. Continued implementation across engines, coupled with scheduled enhancements in 2026, positions the technology for broader adoption in sectors that rely on real-time location intelligence.